
Gross revenue retention (GRR) and net revenue retention (NRR) both measure how much recurring revenue you keep from your existing customers over a period. The difference is one line of the formula: GRR counts only what you lose to downgrades and cancellations, so it can never go above 100%. NRR adds upgrades back in, so it can. NRR is always equal to or higher than GRR, and the gap between them is your expansion revenue.
This post is part of our revenue leak series, a spoke of the guide to net revenue retention, which covers the NRR formula in full. Here we put the two numbers side by side: how each is calculated, what counts, what good looks like in 2025, and what it means when they disagree.
What is gross revenue retention?
Gross revenue retention is the share of last period's recurring revenue that the same customers still pay you, counting only losses. Usually the period is 12 months and the group is every customer you had on day one.
GRR = (starting recurring revenue − contraction − churned revenue) ÷ starting recurring revenue × 100
Contraction is downgrades and fewer seats. Churned revenue is customers who cancel or don't renew. Upgrades never count, and neither do new customers. That makes GRR a pure measure of the leak: 100% means you lost nothing, and it can't go higher.
GRR is also the other side of revenue churn: if you lose 13% of your starting revenue to downgrades and cancellations in a year, your revenue churn is 13% and your GRR is 87%.
What is net revenue retention?
Net revenue retention uses the same customers, the same period and the same losses, then adds expansion: upgrades, extra seats, add-ons and usage growth from those customers.
NRR = (starting recurring revenue + expansion − contraction − churned revenue) ÷ starting recurring revenue × 100
Because expansion can be larger than the losses, NRR can go above 100%. Above 100%, your existing customers grow on their own, even if sales closes nothing new. The NRR guide covers the formula step by step, including how to handle monthly numbers.
GRR vs NRR: the difference at a glance
| Gross revenue retention (GRR) | Net revenue retention (NRR) | |
|---|---|---|
| Question it answers | How much revenue do we keep? | How much do we keep and grow? |
| Starting revenue | Existing customers on day one | The same |
| Downgrades and cancellations | Subtracted | Subtracted |
| Upgrades, seats, add-ons | Left out | Added |
| New customers | Left out | Left out |
| Highest possible value | 100% | No limit |
| Also called | Gross dollar retention | Net dollar retention (NDR) |
| Median, B2B SaaS, 2025 | 91% | 101% |
Benchmarks: SaaS Capital, 2025.
How to calculate GRR and NRR: a worked example
The numbers below are illustrative, for a made-up company, and match the example in the NRR guide.
On January 1 your customers pay you $100,000 in MRR. Over the next 12 months, the same customers add $18,000 in upgrades and seats, downgrade by $4,000, and $9,000 of revenue cancels. Customers who signed during the year are left out.
| Part | GRR | NRR |
|---|---|---|
| Starting MRR (January 1 customers) | $100,000 | $100,000 |
| Expansion: upgrades, seats, add-ons | not counted | +$18,000 |
| Contraction: downgrades | −$4,000 | −$4,000 |
| Churned revenue: cancellations | −$9,000 | −$9,000 |
| End | $87,000 ÷ $100,000 = 87% | $105,000 ÷ $100,000 = 105% |
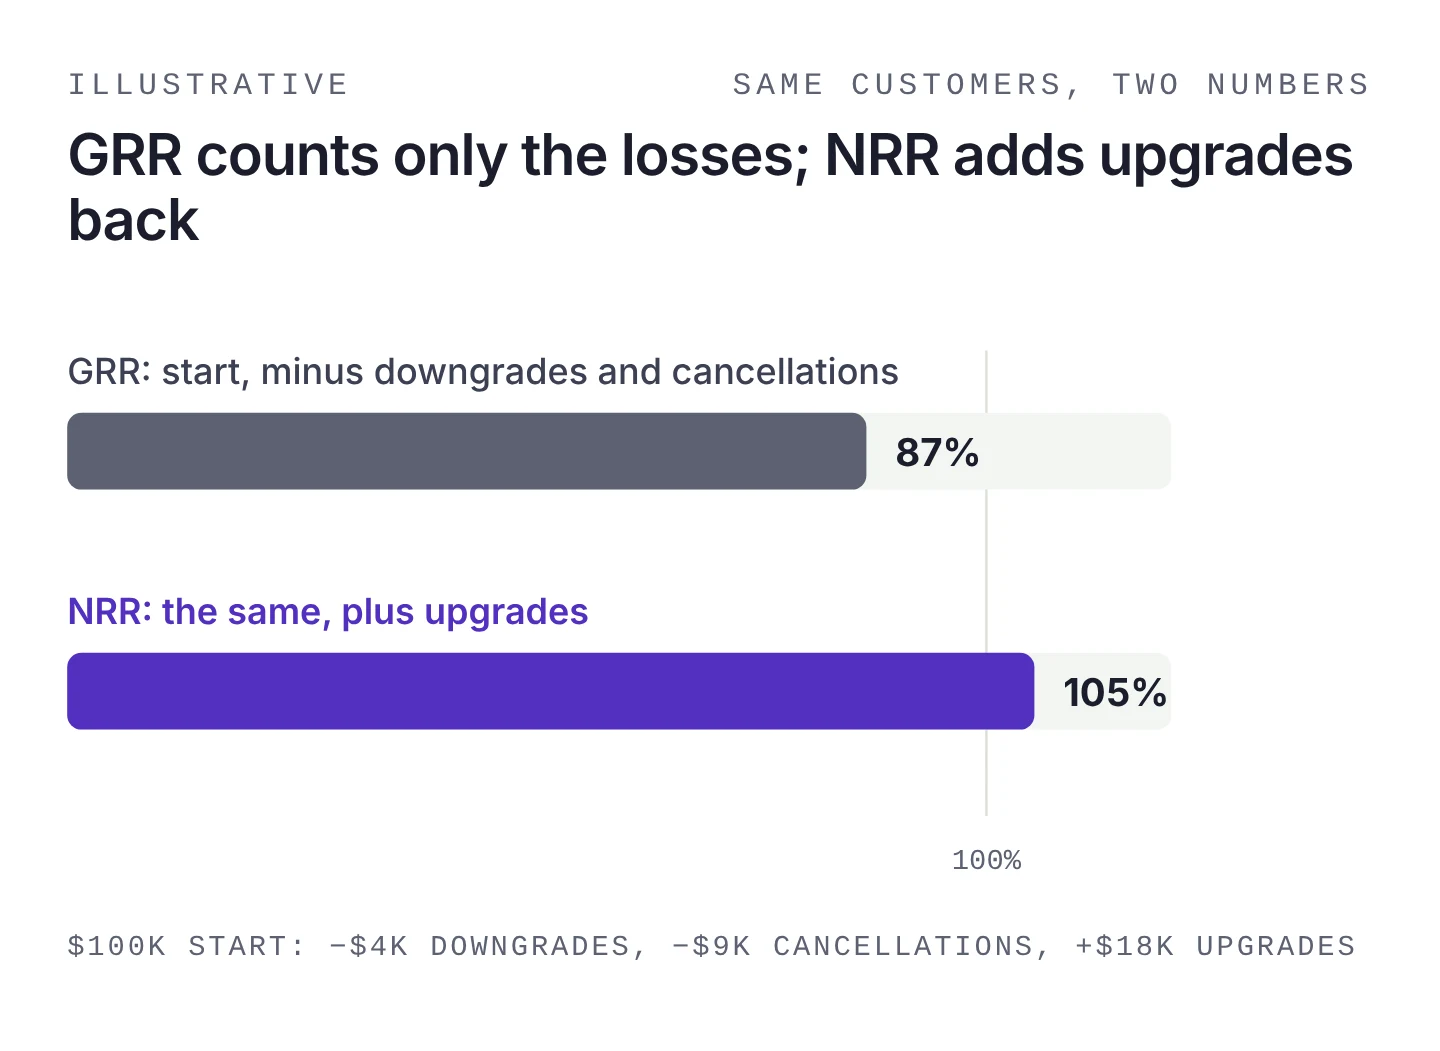
The gap, 18 points, is exactly the expansion: $18,000 on a $100,000 start. Read on its own, 105% looks healthy. Read with 87%, it says the company loses 13% of its revenue every year and replaces it with upgrades from the customers who stay. To run your own numbers, the churn rate calculator gives GRR and NRR side by side.
Calculate them per customer, not just in total. List every customer from day one with what they paid then and what they pay now. For GRR, cap each customer at their starting revenue (a customer who went from $500 to $800 counts as $500); for NRR, use what they pay now. Then add up each column and divide by the starting total. Doing it customer by customer stops one large upgrade from quietly hiding a cancellation in GRR.
Is net dollar retention the same as NRR?
Yes. Net dollar retention (NDR) is another name for net revenue retention, more common in investor reports and public company filings. Gross dollar retention is likewise another name for GRR. Some companies say "dollar-based net retention rate": same metric again.
What does differ between companies is the detail, so check three things before comparing two numbers:
- The period. Annual retention on a 12-month group is the standard. A monthly number isn't comparable until you compound it (the NRR guide shows how).
- The unit. MRR or ARR, the same at the start and the end. One-off fees such as setup and services stay out.
- Price increases. SaaS Capital counts them as expansion: in NRR, but left out of GRR. A company that counts them in GRR will look better than it is.
What counts, and what doesn't
Both numbers only follow customers who were paying on day one. That rule settles most edge cases:
- A new customer who signs in month 2: in neither. It's growth from sales, not retention.
- An upgrade from a day-one customer: in NRR only.
- A day-one customer who cancels, then comes back in month 9: they're still in the group, so their revenue at the end counts (in GRR, up to what they paid at the start).
- A trial user you win back: in neither, because a trial user wasn't a paying customer at the start.
That last one catches teams out. When we built trial win-back emails for Timelines.AI, they brought back 8 trial users the company had already lost, worth $8K in ARR, within 60 days of launch. That's real revenue, and it shows up in neither GRR nor NRR: those users weren't paying customers on day one, so the $8K is new business. It's the right fix for a trial leak, but if the goal is to move GRR, the work has to be with customers who already pay: onboarding them to value, catching failed payments, and noticing when an account goes quiet.
What is a good GRR and NRR?
Median B2B SaaS gross revenue retention was 91% in 2025, and median net revenue retention was 101% (SaaS Capital, 2025, more than 1,000 private B2B SaaS companies). So the typical company loses about 9% of its starting revenue each year, and upgrades from the customers who stay only just make up for it.
SaaS Capital calls GRR a "table stakes" benchmark: "to have a shot at performance parity with your peers, GRR must be at least 90%." NRR is the one that moves growth. In the same survey, moving NRR from the 100% to 110% band to the 110% to 120% band added 9 points of growth rate, while "the relationship between gross revenue retention and growth is not as direct and shows little correlation."
Where you sell shapes both numbers:
- Contract size. Companies with annual contract values above $250,000 had a median GRR of 95%; below $250,000, about 91%.
- Contract length. Longer contracts keep a little more (chart below).
- Funding. Bootstrapped companies reported 104% NRR and 92% GRR; equity-backed companies, 101% and 90%.
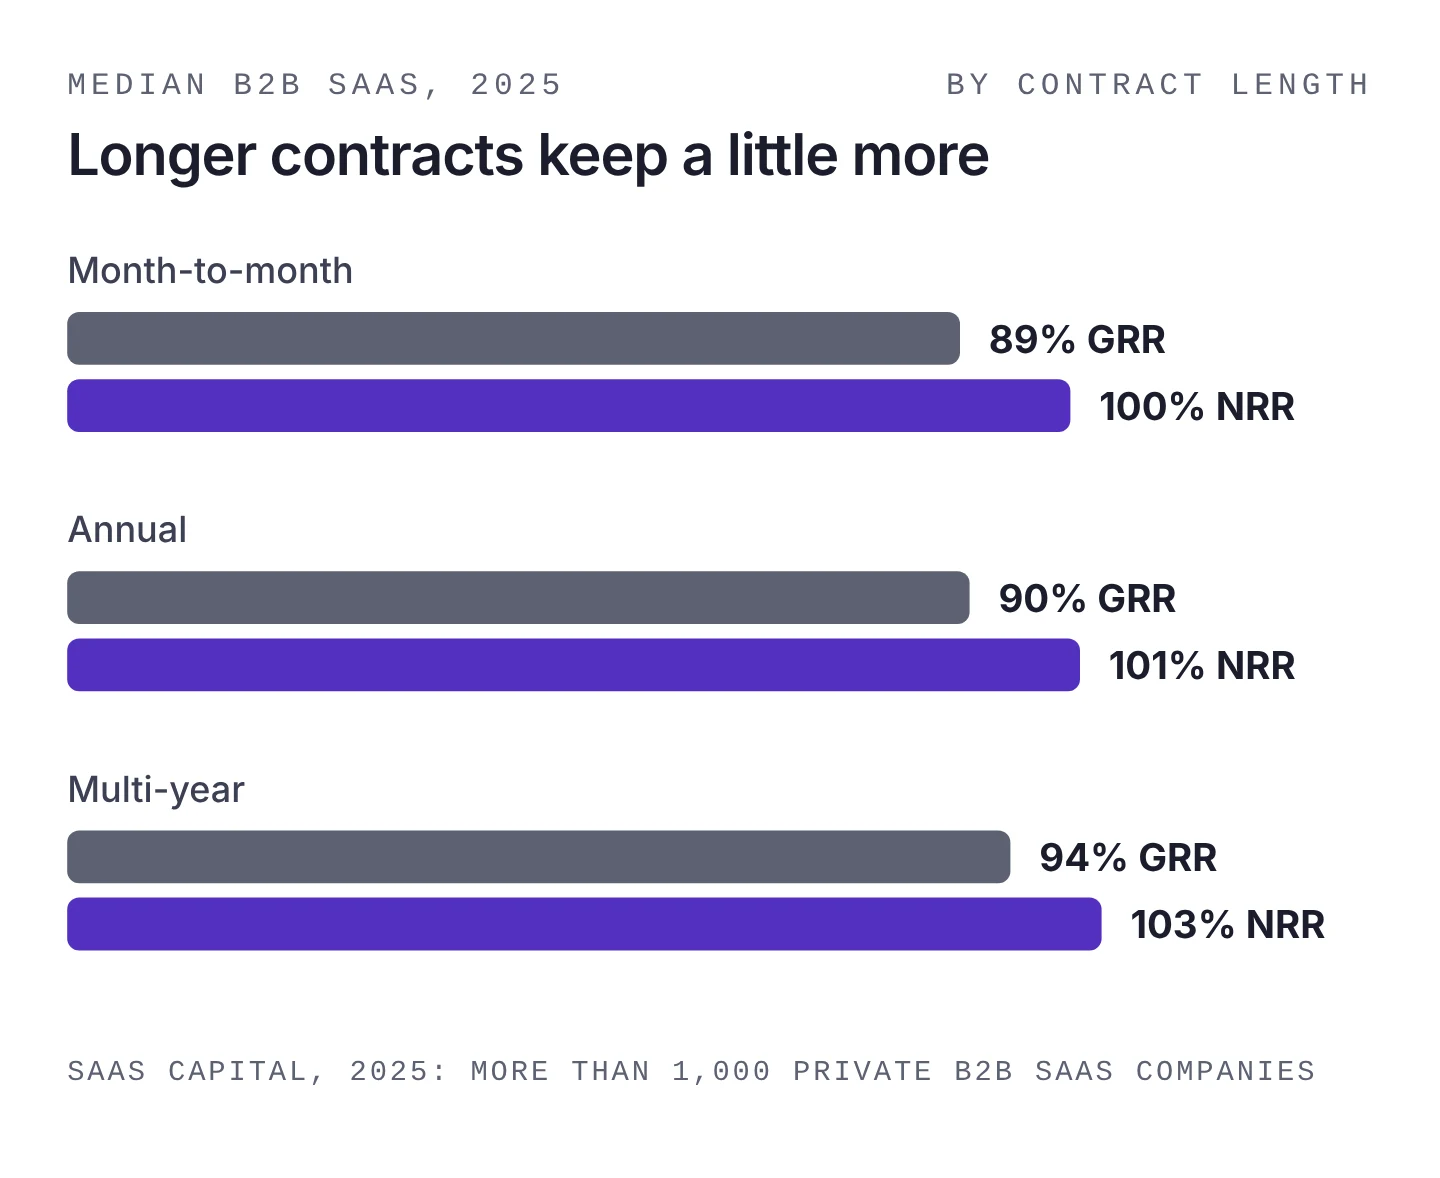
Compare yourself with companies that sell at a similar price first, then with your own past years. A product sold month to month to small businesses won't reach the GRR of one sold on multi-year enterprise contracts, and doesn't need to.
Reading GRR and NRR together
Each number on its own can mislead. Together, they say which leak to fix.
| GRR | NRR | What it usually means | Fix first |
|---|---|---|---|
| 90% or more | Above 100% | Customers stay and grow. | Keep it: watch newer cohorts for slippage |
| 90% or more | Below 100% | Customers stay but don't grow. Upgrades are missing. | Expansion: plans, limits and upgrade prompts that match how customers grow |
| Below 90% | Above 100% | A few customers growing fast cover for many leaving. | Churn: it rarely lasts once the big accounts stop growing |
| Below 90% | Below 100% | Revenue leaks and nothing refills it. | Churn first, starting with the first 90 days and failed payments |
Split both by customer size or plan before you act. One large account upgrading can lift a company's NRR above 100% while most small customers leave, and the total hides it.
Which one to improve first
Start with GRR. Every point of GRR you lose is revenue expansion has to earn back before NRR moves at all, and the causes of low GRR are often the cheapest to fix: failed payments, customers who never reached value in their first weeks, and accounts that went quiet with nobody watching. The churn guide covers how to reduce SaaS churn in five steps.
Once GRR is at or above your peers, NRR is where the growth is: give customers a reason to upgrade at the moment they outgrow their plan. The NRR guide has the full list of where net revenue retention leaks, stage by stage.
How we help
If you know your NRR but not your GRR, or the two disagree and you don't know why, our 48-hour diagnostic finds where revenue leaks between signup and renewal, from your own billing and product data. When the leak is cancellations, the Churn Win-Back Sprint builds the flows that recover at-risk and cancelled revenue; when it's missing upgrades, the Feature Gating Sprint builds the upgrade prompts. Book a 20-minute call with Jamie to talk it through.
Questions
What is the difference between GRR and NRR?
Both measure the recurring revenue you keep from existing customers over a period. Gross revenue retention (GRR) counts only losses, downgrades and cancellations, so it can never go above 100%. Net revenue retention (NRR) also adds upgrades, extra seats and add-ons from the same customers, so it can go above 100%.
Is NRR always higher than GRR?
NRR is always equal to or higher than GRR. They use the same customers and the same losses; NRR only adds expansion on top. They are equal when existing customers didn't upgrade at all.
Is net dollar retention the same as net revenue retention?
Yes. Net dollar retention (NDR) is another name for net revenue retention, common in investor reports and public company filings. Gross dollar retention is likewise another name for gross revenue retention. Check the period and the unit before comparing two companies' numbers.
What is a good gross revenue retention rate?
Median B2B SaaS gross revenue retention was 91% in 2025 (SaaS Capital, more than 1,000 private B2B SaaS companies). SaaS Capital calls GRR a table stakes benchmark: at least 90% to keep up with your peers. Companies with contracts above $250,000 a year had a median of 95%.
Which matters more, GRR or NRR?
You need both. SaaS Capital (2025) found growth rate closely follows NRR, while GRR shows little link to growth. But GRR is the floor NRR is built on: expansion that has to cover heavy losses every year rarely lasts.